
Windows Performance Toolkit for Windows 10
All are talking about Windows 10 but what about the developer Tools? Since 4/20/2015 you can also download the beta of the upcoming Visual Studio 2015 and Windows / Phone SDKs. This includes also a new version of the (at least for me) long awaited Windows Performance Analyzer. You can get the ISO image here:
http://dev.windows.com/en-us/windows-10-developer-preview-tools?ocid=WIP_r_Mar_Body_SDK
From there you can download the iso file for the tools. You do not need to install Visual Studio CTP for this. Now mount the iso files and install for x64 Windows versions (x86 is also there)
\packages\OneSDK\Windows App Certification Kit x64-x86_en-us.msi
This will put the new Windows Performance Toolkit under
C:\Program Files (x86)\Windows Kits\10\Windows Performance Toolkit
You do not need Windows 10 to be able to install the toolkit beta. You can install the kit at least on Win 8.1 and (not tested) also on Win7 machines.
Update 1
You can download the released pieces with the Windows 10 SDK installer here: https://dev.windows.com/en-us/downloads/windows-10-sdk
To download just the SDK run the installer and uncheck everything except the Windows Performance Toolkit. If you want to install it offline you can choose a download directory from where you can copy the msi files on machines with e.g. no internet connection. From the download directory you need only the files
WPTx64-x86_en-us.msi (64 bit Windows versions since Windows 7)
WPTx86-x86_en-us.msi (32 bit Windows versions since Windows 7)
So what's inside? As far as I can tell the changes are not too dramatic but some nice improvements are there.
Xperf
Added option to -injectonly -merge.
-injectonly Do not copy (merge) events, only inject
image identification information. Cannot be
used with -mergeonly.
What is the meaning of this? You can extract from a kernel trace file the events into a separate file and then merge a user etl file which will then become readable with WPA (albeit the process names do not show up).
This will generate the extract of the kernel etl file:
xperf -merge c:\temp\LowLatencyGCEvents.kernel.etl c:\temp\lowlatnetinjected.etl -injectonly
Now you can merge it with a user mode session etl file without ending up with a multi GB etl file if the user mode session contains only a few interesting events in which you are interested in.
xperf -merge c:\temp\LowLatencyGCEvents.etl c:\temp\lowlatnetinjected.etl c:\temp\mergedWithImage.etl
Besides this there are no new features to xperf that are worth noting.
WPA
Now you can open the enriched user mode etl file with WPA and finally you can read the events:
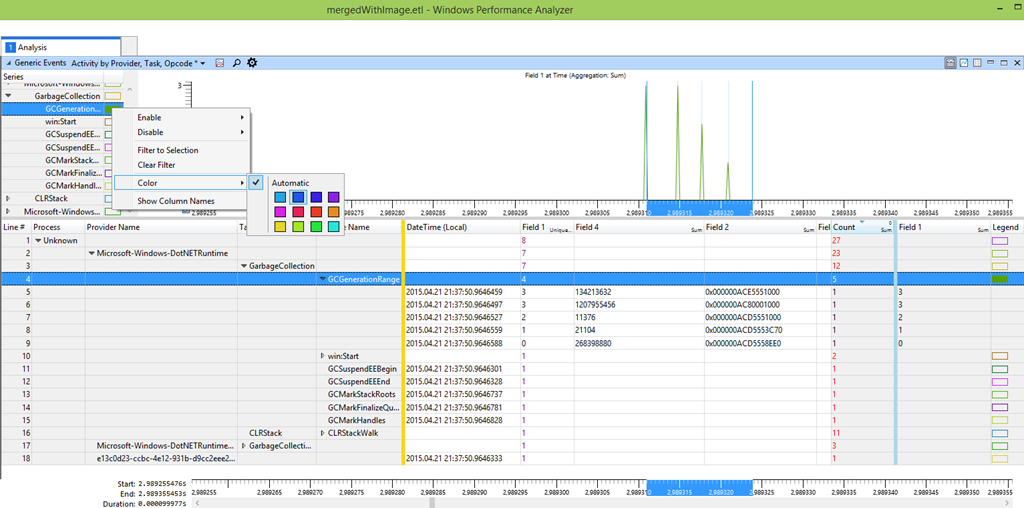
Which new features do you spot in the picture above?
- Colors! You can select the colors you want for your graphs.
- You can graph numerical data from custom events now!
- This works currently only to some extent. I hope it will get better in the released version.
- The main issue is that it cannot graph hex values which have defined in their event template as outType hex values: