
The Watch window (actually there are four different Watch windows you can use) is easily the most powerful aspect of the Visual Studio debugger and the underlying technology it uses actually surfaces in several places:
- Watch
- Autos
- Locals
- Quick Watch
- “Data Tips” (the debugging tool tips that appear when you hover over a code element)
The thing that most people might not realize is that you can actually call methods in the Watch window. This is useful because it allows you to see data structures that might not otherwise display well and you can also have completely dynamic assertions.
Calling a method in the Watch window is as simple as adding the parenthesis and any parameters needed.
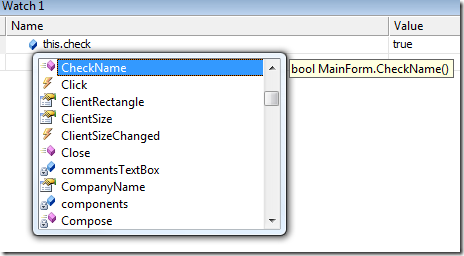
There are a few considerations to be aware of when doing this, however. They are:
- The function (property or method) executes in the context of the debuggee.
- Don’t do anything more than reading memory.
- The method must execute in less than 20 seconds.
- Breakpoints are not hit when called from the Watch window.
Another very useful trick is that the Watch window supports drag and drop from the code editor. Simply select the expression in the code editor and drag it to the watch window.
Just like you can execute functions in the watch window, you can execute them in the Value column of the Watch window as well. This allows you to easily change the value of a watched expression to a completely new instance of an object. In the Value column, simply enter “new SomeClass()” to set the value to a new instance of the SomeClass object.
From the Immediate window you can type in an expression to allocate on object
1: ? SomeClass x = new SomeClass()
and then in the Value column enter the variable prefixed with a “$” sign. (In this example, $x.)
Finally, let’s take a look at the Make Object ID capability of the debugger. This is available from the Locals and Autos windows through the context menu. Simply select the object you are interested in and right click, then choose the Make Object ID. This will create a numeric ID for that object, which will be displayed after the value.

What is actually happening here is that it tells the debugger to watch a particular object in memory no matter where it goes. This is useful because if the actual object goes out of scope you can still watch it by using the object ID. If the object ID says “Can’t evaluate” then it means the object has been garbage collected. Object IDs can also be used in conditional breakpoints and as parameters to function calls.
For instance, if you wanted to know what GC generation an object is in, you can do so using Object IDs.

