CLR Profiler is a free and incredibly useful tool offered by Microsoft. I’m fairly certain its primary use (at least from Microsoft’s perspective) is to illustrate use of the CLR Profiling COM APIs, which aren’t exceptionally clear-cut (in my opinion), particularly from a .NET programmer’s point of view. The really difficult part of using CLR Profiler is becoming accustomed to its interface and the data it presents; however, once you do so, I’m certain you’ll find it incredibly helpful in addressing difficulties with memory usage. This article aims to introduce you to the “important parts” of CLR Profiler – specifically, which graphs you should view, how you should interpret them, and how to address the problems you find. This article will not review some of the more complicated parts of injecting CLR Profiler into something such as your ASP.NET application; there are other resources for that purpose.
For the purposes of this article, I’ve re-introduced a wasteful error into BN# that I found by using CLR Profiler. We’ll work through finding it in this article.
Getting Started
Once you have CLR Profiler “installed” – and I use the term loosely – you can start the application from the install path (don’t look for a Start Menu item). There are two versions of binaries, x86 and x64 versions; you should know which edition of the application you’d like to run. If you’re running a platform-neutral application (most .NET apps would fall under this category), and you’re on an x64 system, you should use that one. If you’re running 32-bit Windows, or are running a program specifically targeted to x86, then you should run the x86 version of CLR Profiler.
As an important note, for Windows Vista users, if you’re running with UAC enabled, make sure to run CLR Profiler as an administrator. CLR Profiler works by injecting a COM DLL into the target, but it can’t do that if you’re not running the process as an administrator.
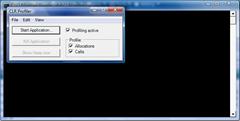
When profiling memory, I turn off Calls tracking: it’s located in the bottom-right of the UI window.
If your application requires access to the local application directory – for instance, by using the Application class in Windows Forms – you should go through the explicit Profile Application menu item within the File menu, and set the working directory option of that UI. Otherwise, go ahead and click Start Application, browse to your application, and go.
During Operation
Other than the fact that your application will be measurably slower, you should be able to run the application as you otherwise would. Your mileage will vary, but you’ll get better results with more memory in your system. But all developers have at least 4gb powering their boxes now, right?
During the application, you can click on the Show Heap now button on the main CLR Profiler GUI, which will display a heap graph of the current application, displaying the path to all currently allocated memory:
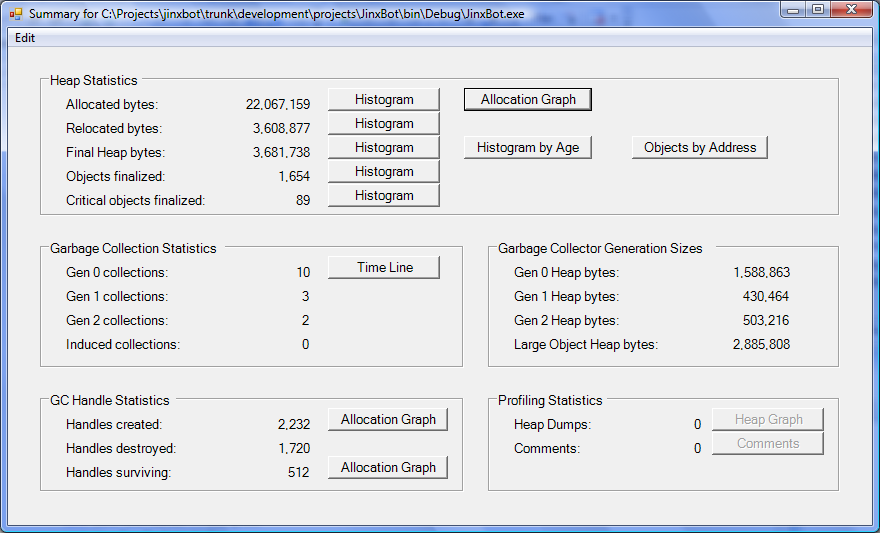
To be honest, I find the heap graph to be relatively confusing, but the good news is that you don’t need to keep using it. But once you’ve dumped that temporary log, you can view the current heap and interesting information by closing that window and, in the main CLR Profiler window, going to the View menu, and choosing Summary, which displays a cool window:
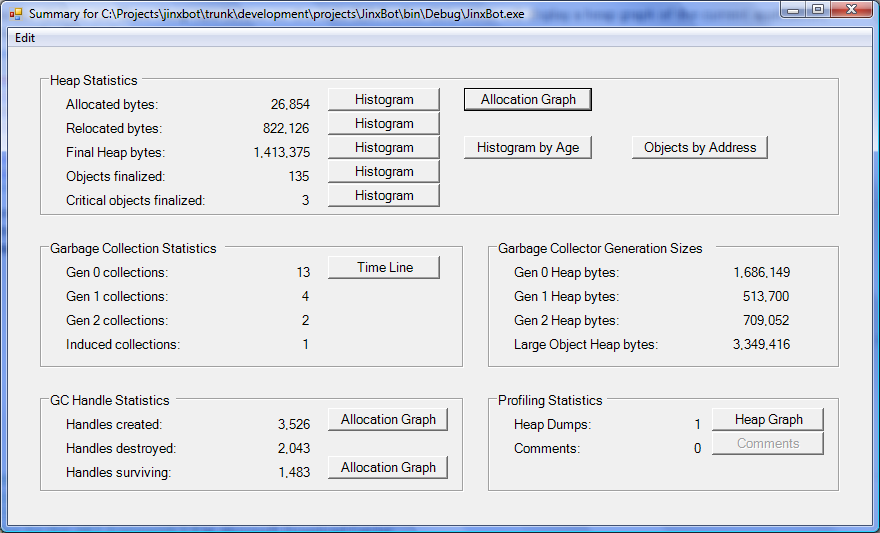
This window helps you understand what’s happening:
- Allocated bytes is really interesting – it relates the total amount of memory that you’ve allocated within managed code.
- Final Heap Bytes is the amount of managed memory that currently is in use on the heap. This doesn’t necessarily reflect unmanaged items.
- Relocated Bytes is the amount of memory that has been moved by the garbage collector during compaction operations.
- Gen X collections shows the number of garbage collections that have occurred for each generation.
- Garbage Collector Generation Sizes shows the number of bytes being used by each heap.
What’s Happening with BN#?
I had a suspicion based on memory usage (reported by Task Manager) that BN# wasn’t quite as efficient as I would have hoped. I wanted to do some investigation, so I plugged in CLR Profiler. After a 30-second (or so) connection to Battle.net, joining Clan Recruitment, this is what I saw:
That’s pretty heavy – 31mb or so total allocated memory but only ending up with about 3mb on the heap and only 3.5mb were relocated throughout the lifetime of the app – that told me that I was doing a lot of allocating and freeing very rapidly. What’s the next step?
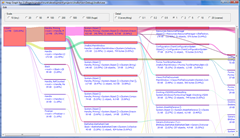
I clicked on the Allocation Graph button and took a look:
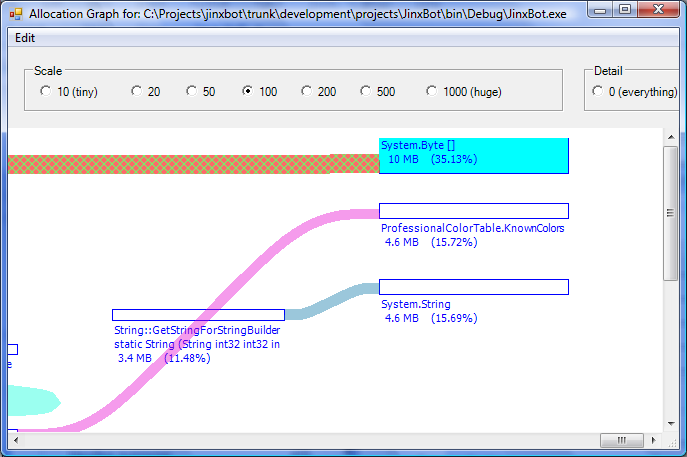
In this we can see that byte arrays are on the heap frequently and account for about 35% of all memory allocations. That’s a big problem – especially since I pooled their creation already! CLR profiler helps me track it down though, as I follow the highlighted call chain back to its source:
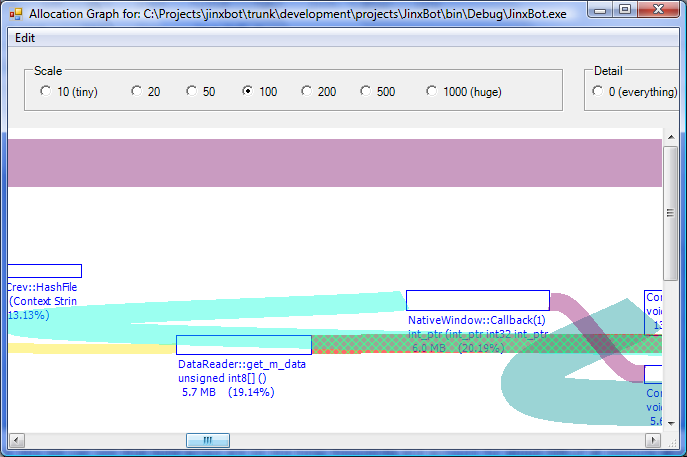
This image indicates that I have a problem with a method called DataReader::get_m_data(). Now, as I mentioned, I had to recreate this problem, and the path of least resistance for me was to change the identifier m_data (used frequently in DataReader) to be a property instead of a field, so originally this said get_Data. I thought that was odd until I saw its implementation:
protected virtual byte[] Data {
  get {
    byte[] dataCopy = new byte[_m_data.Length];
    Buffer.BlockCopy(_m_data, 0, dataCopy, 0, dataCopy.Length);
    return dataCopy;
  }
}
So here, for every operation that accesses the Data property (in the original implementation, it was every operation, because the Data property was virtual), I was duplicating the entire array. EVERY TIME.
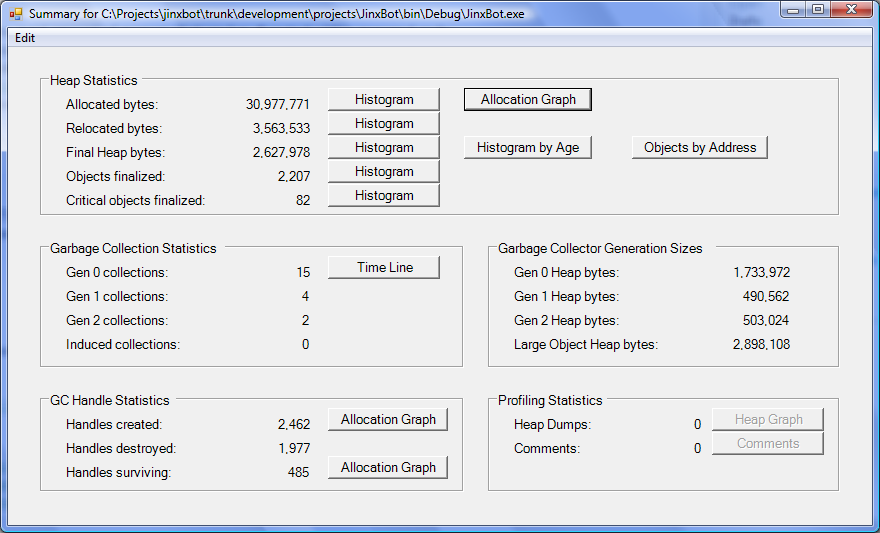
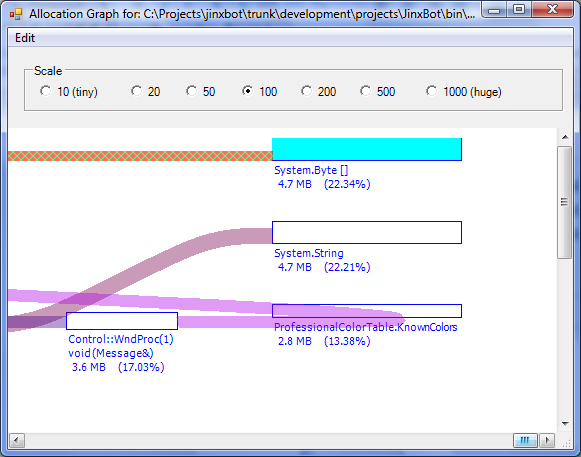
I then changed the implementation so that operations defined within the base class wouldn’t needlessly go through a property, and derived classes had direct access to the buffer by reference (via the UnderlyingBuffer property). What were my results?
I think that fairly well speaks to the effectiveness of using tools like this. 🙂 A decrease of 27% in allocations, 33% in gen-0 collections, and 53% decrease of the amount of byte[] allocations:
Further Reading
- CLR Profiler, your memory spy at Programmers’ Heaven – this is the best article I’ve seen on the subject
- How To: Use CLR Profiler at MSDN
- CLR Profiler Is Your Friend at Chris Topholt’s blog
- Download: CLR Profiler for the .NET Framework 2.0 at Microsoft Download Center
The “Speedy C#” Series:
- Part 1: Optimizing Long if-else or switch Branches
- Part 2: Optimizing Memory Allocations – Pooling and Reusing Objects
- Part 3: Understanding Memory References, Pinned Objects, and Pointers
- Part 4: Using – and Understanding – CLR Profiler
- Part 5: Using Threads with Waits, or “Don’t Kill Your CPU”
posted on Friday, March 13, 2009 2:34 AM