All of us have experienced it but very few of us have gone into the details to really find the reasons for it. First of all why should I care? After the first time the application starts much faster. Well you should care if you want to give your customer not only a good second startup time but also a decent first startup experience. To do that you need to do repeated tests. The first startup is commonly referred to cold startup and all subsequent runs are warm startup scenarios. To test a cold startup scenario you need to reboot your computer every time and start your application. Not very practical and I have no one ever seen going down that road. The difference between warm and cold startup time is that the first time the dlls and data of the application need to be loaded from disc which can take quite some time. All subsequent runs can read the data not from disk but from the in memory file system cache which is managed by the operating system.
What Is The File System Cache?
Windows uses the memory of your system in some clever way. All memory that is used by your applications is shown in the Task Manager. The rest of the memory is free and not used by anything. Really? Of course not. The free memory consists of data of previously exited applications which was in use some time a ago. This “free” memory is called Standby List which is where the file system cache of Windows is really living. It is therefore not a good idea to max out your memory usage in task manager because if you do this you are flushing the file system cache which will result in a slow system. This cache is the reason why your second and all further startup times are much better. No disc accesses at all compared to the first run if all goes well.
How can you flush it?
If you want to measure cold startup times you need to clear the file system cache somehow. The easiest way is to use RAMMap from SysInternals. It has an option to flush the Standby List.
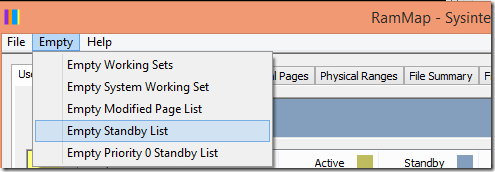
That is nice but unfortunately there is no command line tool available to do this in a test script to create repeatable tests. But not all is lost. Process Hacker is a better clone of Process Explorer which comes with full source code. There you can find the undocumented Windows API calls to flush the OS file system cache directly. It is basicallySYSTEM_MEMORY_LIST_COMMAND command = MemoryPurgeStandbyList; NtSetSystemInformation(SystemMemoryListInformation, &command, sizeof(SYSTEM_MEMORY_LIST_COMMAND));
and you are done. There is also another trick I want to share: You want to clear the file system cache for a specific file? Windows will flush the file system cache if a file was opened with the FILE_FLAG_NO_BUFFERING flag. Here is little C# class that employs this trick:
class FileSystemTools {
  const int FILE_FLAG_NO_BUFFERING = 0x20000000;
  const FileOptions Unbuffered = (FileOptions)FILE_FLAG_NO_BUFFERING;

  /// <summary>
  /// Flush the file system cache for this file. This ensures that all
  /// subsequent operations on the file really cause disc access and you can
  /// measure the real disc access time.
  /// </summary>
  /// <param name="file">full path to file.</param>
  public static void FlushFSCacheForFile(string file) {
    using (FileStream fileStream = new FileStream(
               file, FileMode.Open, FileAccess.Read, FileShare.ReadWrite, 4096,
               FileOptions.None | Unbuffered)) {}
  }
}
Hidden Dragons
If the first test run is slow and all other are fast we know that the file system cache is to blame. If you see a pattern like this
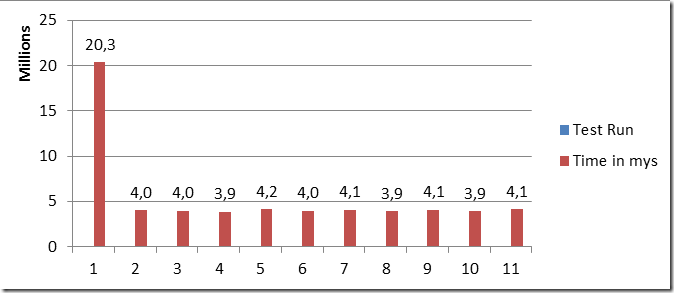
you know that the first run was cold and all others were warm. If we now flush the file system cache we should get rock solid cold times with no other influencers except virus scanner, indexing service and other pesky applications making our test unpredictable. If we measure again – this time with flushing the file system cache – we get this:
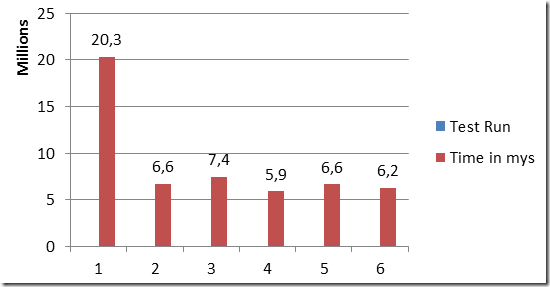
This is not warm and not cold. What is it then? The answer is it was mostly a warm startup because another instance of the application was still running. If the a process is alive and its working set was not trimmed then the dll data is NOT in the cache since it still belongs to the working set of a running process. You need therefore make sure that you close all applications which keep your dlls in memory (e..g Visual Studio with its designers ….) to test a real cold startup scenario. There are other pitfalls as well. If you kill a process without waiting until it has terminated you can get random good runs because a process kill is an asynchronous operation. You have to wait on the process handle until it becomes signaled to be sure that it is really gone. Or if you are using .NET you need to call Process.WaitForExit() to be sure.
After we have fixed that we get this graph:
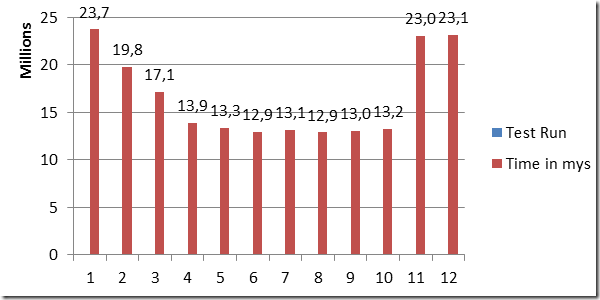
What the hell is going on here? This was quite hard to find out since there is very little information on the net how to reliably test cold startup scenarios. The hidden thing is Superfetch.
Doesn´t ring a bell? Besides speeding up the boot it also tries to prefetch often used application dlls into memory before the application is started based on intelligent heuristics. This gets in our way if we flush the file system cache. After that the Superfetch system service named SysMain which is hosted in a generic svchost.exe process tries to prefetch often used dlls at low IO priority. This is additional IO collides with our test where we want to load our dlls as well. To get consistent IO numbers it is therefore best to stop the Superfetch service.
sc stop SysMain
After doing that the graph still looks the same. What is interesting that if our application reads about 30MB more data it starts nearly 10s faster. This is a mystery which only xperf can solve. Here is a Disc IO graph of a 23s slow run
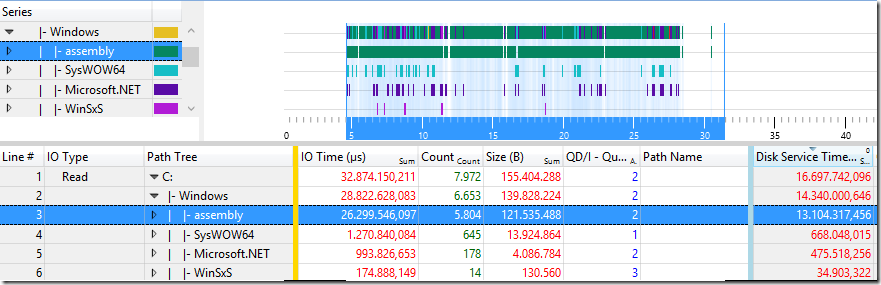

We read more data but the Disc Service Time is less! The average Disc Queue Depth is very high which should indicate an overwhelmed disc. What stands out is that we have about 70% less disc read operations on the assembly folder where the native images of .NET applications are stored. Sometimes we read the disc in a slow and sometimes in a fast way. To answer the question why we read from the disc in such different ways we need to check out the Disc IO Init call stacks. These will tell us who did initiate the read operations and most important when. First comes the slow run
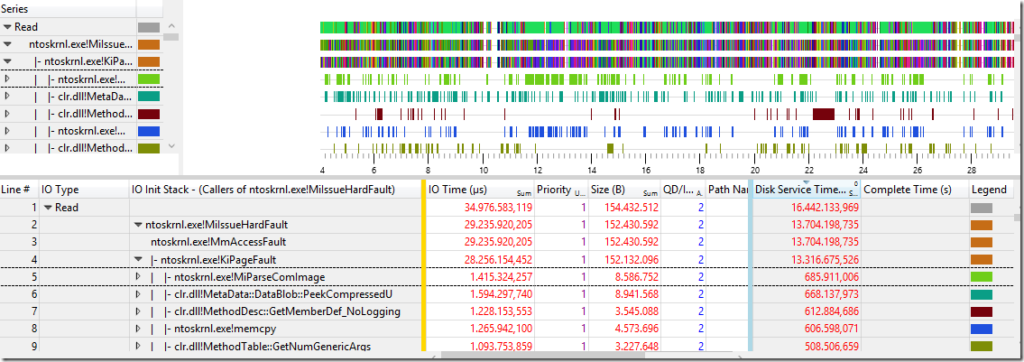
It is no surprise that our slow cold startup causes many hard page faults which triggers the kernel to read the missing pages from disc. This is known to be slow. We can do little about it except to execute less code during startup. The graph shows a nice scattered pattern across the complete startup time. Now lets have a look at the fast run
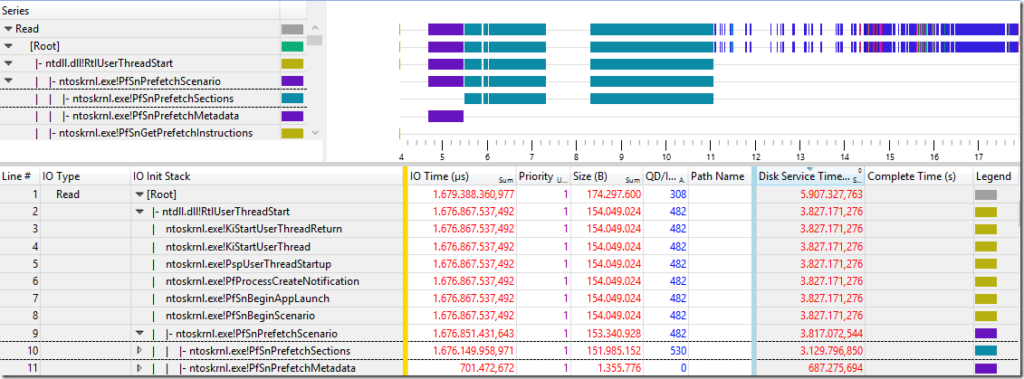
That looks radically different. We load the same dlls but we have no hard faults? All dll data is read before the application main thread starts running. In our process the Prefetcher reads its prefetch database which is 1,3MB in size (see PfSnPrefetchMetaData in 687ms) which allows it to read our dlls in PfSnPrefetchSections (151MB in 3,1s) to read the dll data mostly with sequential reads in about half of the time. That is the real reason why we have so wildly varying startup times. The prefetcher will look at ca. the first 12s of application startup and will then update the prefetch database for your executable. Next time the startup is a little better and it will update it again causing it to prefetch a little more and so on. This is a nice self tuning system which not many people are aware of. From time to time the prefetcher seems to do nothing to check (that is my guess) if the prefetch database is helping at all. That explains the mostly good and sometimes very slow numbers whre no prefetching is active.
If we aim at stable cold repeatable tests we need to delete disable the Superfetch service because this process is responsible to write and update the prefetch database. The prefetch database file is located at
C :\Windows\Prefetch\ExeName - FileHashPrefetchFlag.pfWe need to delete that file as well and now we have real control over our IO during application startup. If you want to calculate the file name of your application prefetch database you need to take the full path of your executable and run it through a hash function which is described at http://forensicswiki.org/wiki/Prefetch. There are still some sites out there which tell you to delete the prefetch folder to prevent caching of dlls to make your system faster. If these guys would have really measured their startup time in a controlled and systematic manner they would not have written such misleading guidelines. As you can see you need to take care about a lot of details to really understand your system. But it is worth it. If you have looked closely at the .pf file name there is a PrefetchFlag at the end. That is a number which you can pass to generic container processes to generate for the same executable different prefetch databases. This can be useful if you have generic container processes with wildly varying dll sets inside them. How do you tell the OS loader that you want to use a different prefetch database to speed up cold startup times?
Simple: Pass it as command line parameter! If you create e.g. an executable with the name prefetchTest.exe and pass /prefetch:dd as command line argument to it you get different prefetch files for each scenario:
prefetchTest.exe C :\Windows\Prefetch\PREFETCHTEST.EXE -
    47E1C1B1.pf prefetchTest.exe / prefetch : 1 C
    :\Windows\Prefetch\PREFETCHTEST.EXE -
    47E1C1B2.pf prefetchTest.exe / prefetch : 2 C
    :\Windows\Prefetch\PREFETCHTEST.EXE -
    47E1C1B3.pf
That is a nice find. Perhaps you can make your own customers happier by including a cold startup test in your test suite to make the pain public. Most test reports I have seen include only warm numbers because it is quite difficult to create repeatable and stable cold startup tests. Here are my tips as short bullets for repeatable cold startup measurements:
Test Machine Preparation
- Stop/Disable the Superfetch (SysMain) service.
- Disable Windows Search (WSearch) service.
- Disable Virus scanners.
- Disable scheduled tasks and other system management software.
- Delete the prefetch database for your executable.
Test Execution
- Kill all applications which keep your dlls loaded.
- Flush the file system cache before the test.
When you follow these tips you will get easily repeatable and stable cold startup numbers. If for some reason during startup much more code is executed which causes many page faults you can easily spot it. The warm startup time might not be affected at all because the actual run time of the additional code might be low but the new disc access pattern could be pricy in terms of cold startup time.
posted on Tuesday, August 25, 2015 9:19 AM